Haxby Experiment
The functional architecture of the object vision pathway in the human brain was
investigated using functional magnetic resonance imaging to measure patterns
of response in ventral temporal cortex while subjects viewed faces, cats, five
categories of man-made objects, and nonsense pictures. A distinct pattern of
response was found for each stimulus category.
The distinctiveness of the
response to a given category was not due simply to the regions that responded
maximally to that category, because the category being viewed also could be
identified on the basis of the pattern of response when those regions were
excluded from the analysis. Patterns of response that discriminated among all
categories were found even within cortical regions that responded maximally
to only one category. These results indicate that the representations of faces
and objects in ventral temporal cortex are widely distributed and overlapping.
|
|
|
|---|
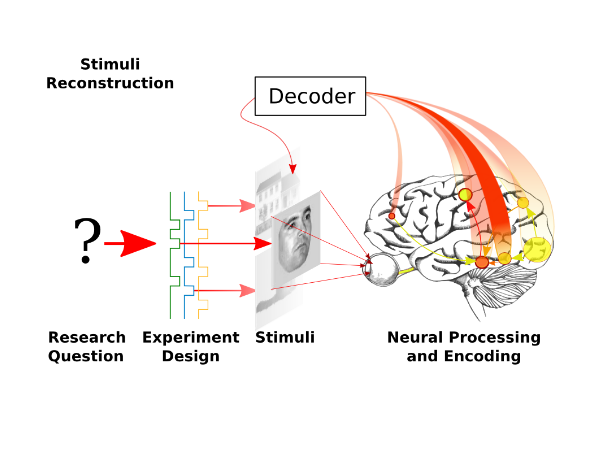
In the original work, visual stimuli from 8 different categories are presented to 6 subjects during 12
sessions. The goal is to predict the category of the stimulus presented to the subject given the
recorded fMRI volumes. For the sake of simplicity, we restrict the example to one subject and try to
analyse the stimulus as per the presented images and in resting state as well.
Haxby Dataset
It is a block design fMRI dataset from a study on face and object representation in human ventral temporal cortex. It consists of 6 subjects/persons with 12 sessions per subject. In each run, the subjects passively viewed greyscale images of eight object categories, grouped in 24s blocks separated by rest periods. Each image was shown for 500ms and was followed by a 1500ms inter-stimulus interval. Full-brain fMRI data were recorded with a volume repetition time of 2.5s, thus, a stimulus block was covered by roughly 9 volumes. This dataset has been repeatedly reanalyzed.
Here,
- ventral : abdominal area,
- temporal : relating to time
- cortex : the outer layer of cerebrum
- cerebrum : the uppermost region of the brain or the biggest part of the brain